Data to Insight: Driving User Satisfaction and Business Growth
How did I get here?
My journey began with a clear goal: to elevate our product’s performance by deeply understanding and addressing the needs of our users. By engaging directly with bankers who use our platform, I focused on optimizing and refining our current features rather than exploring entirely new directions. My mission was to identify and improve the most valuable aspects of our financial analytics feature, aligning them with market expectations and user needs.
The core user needs
Through conversations with bankers, a recurring need emerged: they wanted more detailed analytics on their customers’ transactions. This user story encapsulated their primary requirement:
“As a banker, I want detailed analytics on my customers to effortlessly monitor and analyze a wide range of financial data and transactions directly from my dashboard.”
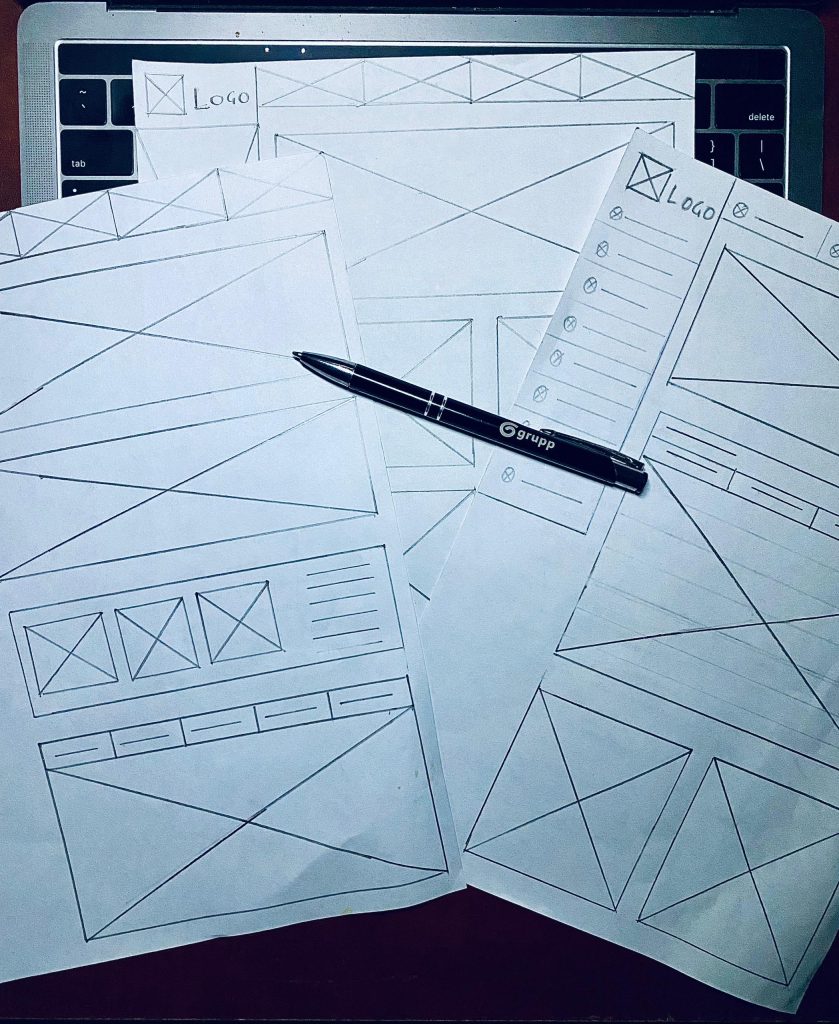
Optimizing Financial Analytics
Our existing financial analytics feature did not fully meet bankers’ expectations. This insight led to a realignment of our goals to streamline the feature to meet user demands. To guide this optimization, I adopted the AARRR Framework to ensure our product development addressed every aspect of the user journey:
AARRR Framework Adoption
To maximize the benefits of this enhancement journey, I employed the AARRR Framework. This framework provided a comprehensive overview of the user journey, ensuring that product development consistently aligns with user desires and requirements.
Acquisition: How do bankers discover this feature?
Activation: How do bankers engage with it?
Retention: Do bankers continue to use the feature regularly?
Referral: Are bankers recommending it to others?
Revenue: What value are bankers placing on this feature?
Cross-Functional Collaboration: My role
Research and Insights: Conducted thorough research to understand industry trends and user expectations. Engaged directly with bankers to gather feedback and pinpoint specific needs for detailed analytics.
Communication: Ensured smooth communication between users, stakeholders, and the development team. Created a roadmap prioritizing features based on their business impact and user value.
Data-Driven Decision-Making: Collaborated with cross-functional teams including data analytics, design, research, and engineering to implement data-driven solutions. Defined key metrics aligned with the AARRR Framework, ensuring that the financial analytics feature met both functional requirements and user-friendly standards.
Risk Management: Performed a comprehensive risk assessment to identify potential operational, reputational, and legal risks. Worked closely with legal and compliance teams to navigate financial regulations affecting the product.
Stakeholder Impact
Feedback: Positive feedback from stakeholders highlighted the alignment of the feature with strategic business goals and user needs.
Decision-Making: Key decisions were informed by a combination of user feedback, market analysis, and stakeholder input, ensuring a balanced approach to feature development.
Quantitative Results
Benchmarking: Compared to industry benchmarks, our feature surpassed competitors in usability and data depth, setting a new standard for financial analytics tools.
ROI Analysis: The feature enhancements contributed to a 30% increase in monthly revenue, demonstrating a strong return on investment.
Future Vision
Long-Term Impact: The feature is a key component of our vision to offer a comprehensive suite of financial analytics tools that evolve with user needs.
Innovation Pipeline: Future plans include integrating predictive analytics and customizable reporting features to further improve user experience.